


Every investor has no doubt come across the phrase ‘past performance is not indicative of future results’, either under a performance graph or in the disclaimer note of a marketing presentation.
Therefore, it is also indicated that “no current or prospective client should assume that future performance… will be profitable or equal to corresponding indicated performance levels”.
Yet it always forms the core of any due diligence process, as it may provide investors with more confidence that the fund manager is a bright individual. It is assumed that intelligence does not vanish overnight.
In this article, I have tried to demonstrate how accurate this statement is, and how it hopefully makes investors rethink their approach to fund selection.
I decided to use the performance data for UK equity managers since December 1989 that is being represented by the Investment Association UK All Companies and IA UK Equity Income sectors.
Using the excess return relative to the FTSE All Share (ex-IT) index, I calculated the R squared (a measure of how closely those data are) from one calendar year to another.
In other words, I tried to assess the probability of excess return repeatedly from a previous year to the next one. The graph below displays the results.
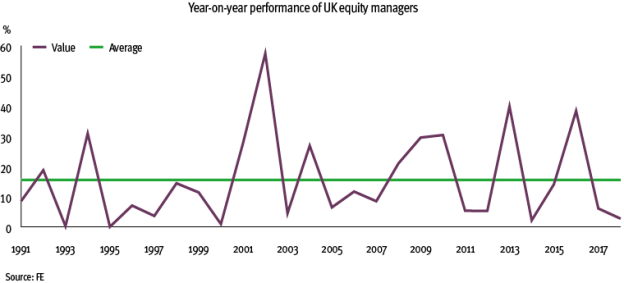
With a long-term average R squared of 15.5 per cent, excess return appears to be a poor indicator. Based on those results, the probability that a fund manager will repeat another good year of outperformance is low.
This chart highlights the years when momentum accelerated, but also indicates the years when market rotations badly impacted the investment industry. 2001 and 2002 were exceptional years for momentum managers, as well as the periods 2008-2010 and 2015-2016.
But even when the R squared reached its peak of 57.4 per cent in 2002, the excess return squared remained a poor indicator.
One calendar year might not be long enough for an investment manager to fully display their skills. Therefore, I decided to extend the study period to three years, which corresponds to a short business cycle.
Not only did my calculations further prove that R squared is a poor indicator, but also that it has not improved.
The long-term average of the R squared stands at 11.9 per cent.
There is still no evidence past performance is a guarantee for future performance, even when extended to a business cycle period.
Following this, I wondered if any financial measure could pass this test. In other words, is there any performance ratio with which past data could be used to forecast the future numbers? It is possible to analyse the average R squared since 1989, from one calendar year to another and draw the following conclusions:
• It is only possible to get information about the activeness of a fund relative to its benchmark when studying past performance. Even then, it only explains 50 per cent of the future activeness of the fund.
• Like the excess return ratio, there is little evidence that the fund’s future beta relative to its benchmark will be in line with its beta in the past.

